

Report features breakdown of light-duty market share by powertrain; research suggests optimized charging could avoid hundreds of dollars in annual EV costs per EV
Washington, D.C.—Alliance for Automotive Innovation has released its state-by-state analysis of the U.S. electric vehicle market for Q1 2026, which summarizes EV sales and purchasing trends across all 50 states.
The report features a breakdown of light-duty market share by powertrain (2016-2026), an analysis of registered EVs and charging infrastructure, and a look at how vehicle-to-grid integration can optimize EV charging, reduce costs for EV drivers and improve utilization of existing grid infrastructure.
Here are highlights from the report.
154 electric models now available for sale in U.S.
- 154 electric car, utility vehicle, pickup truck and van models are now available for sale in the U.S. as of Q1 2026, a decline from 164 at the end of 2025.
- Light truck sales represented 86 percent of the EV market, the highest share on record.
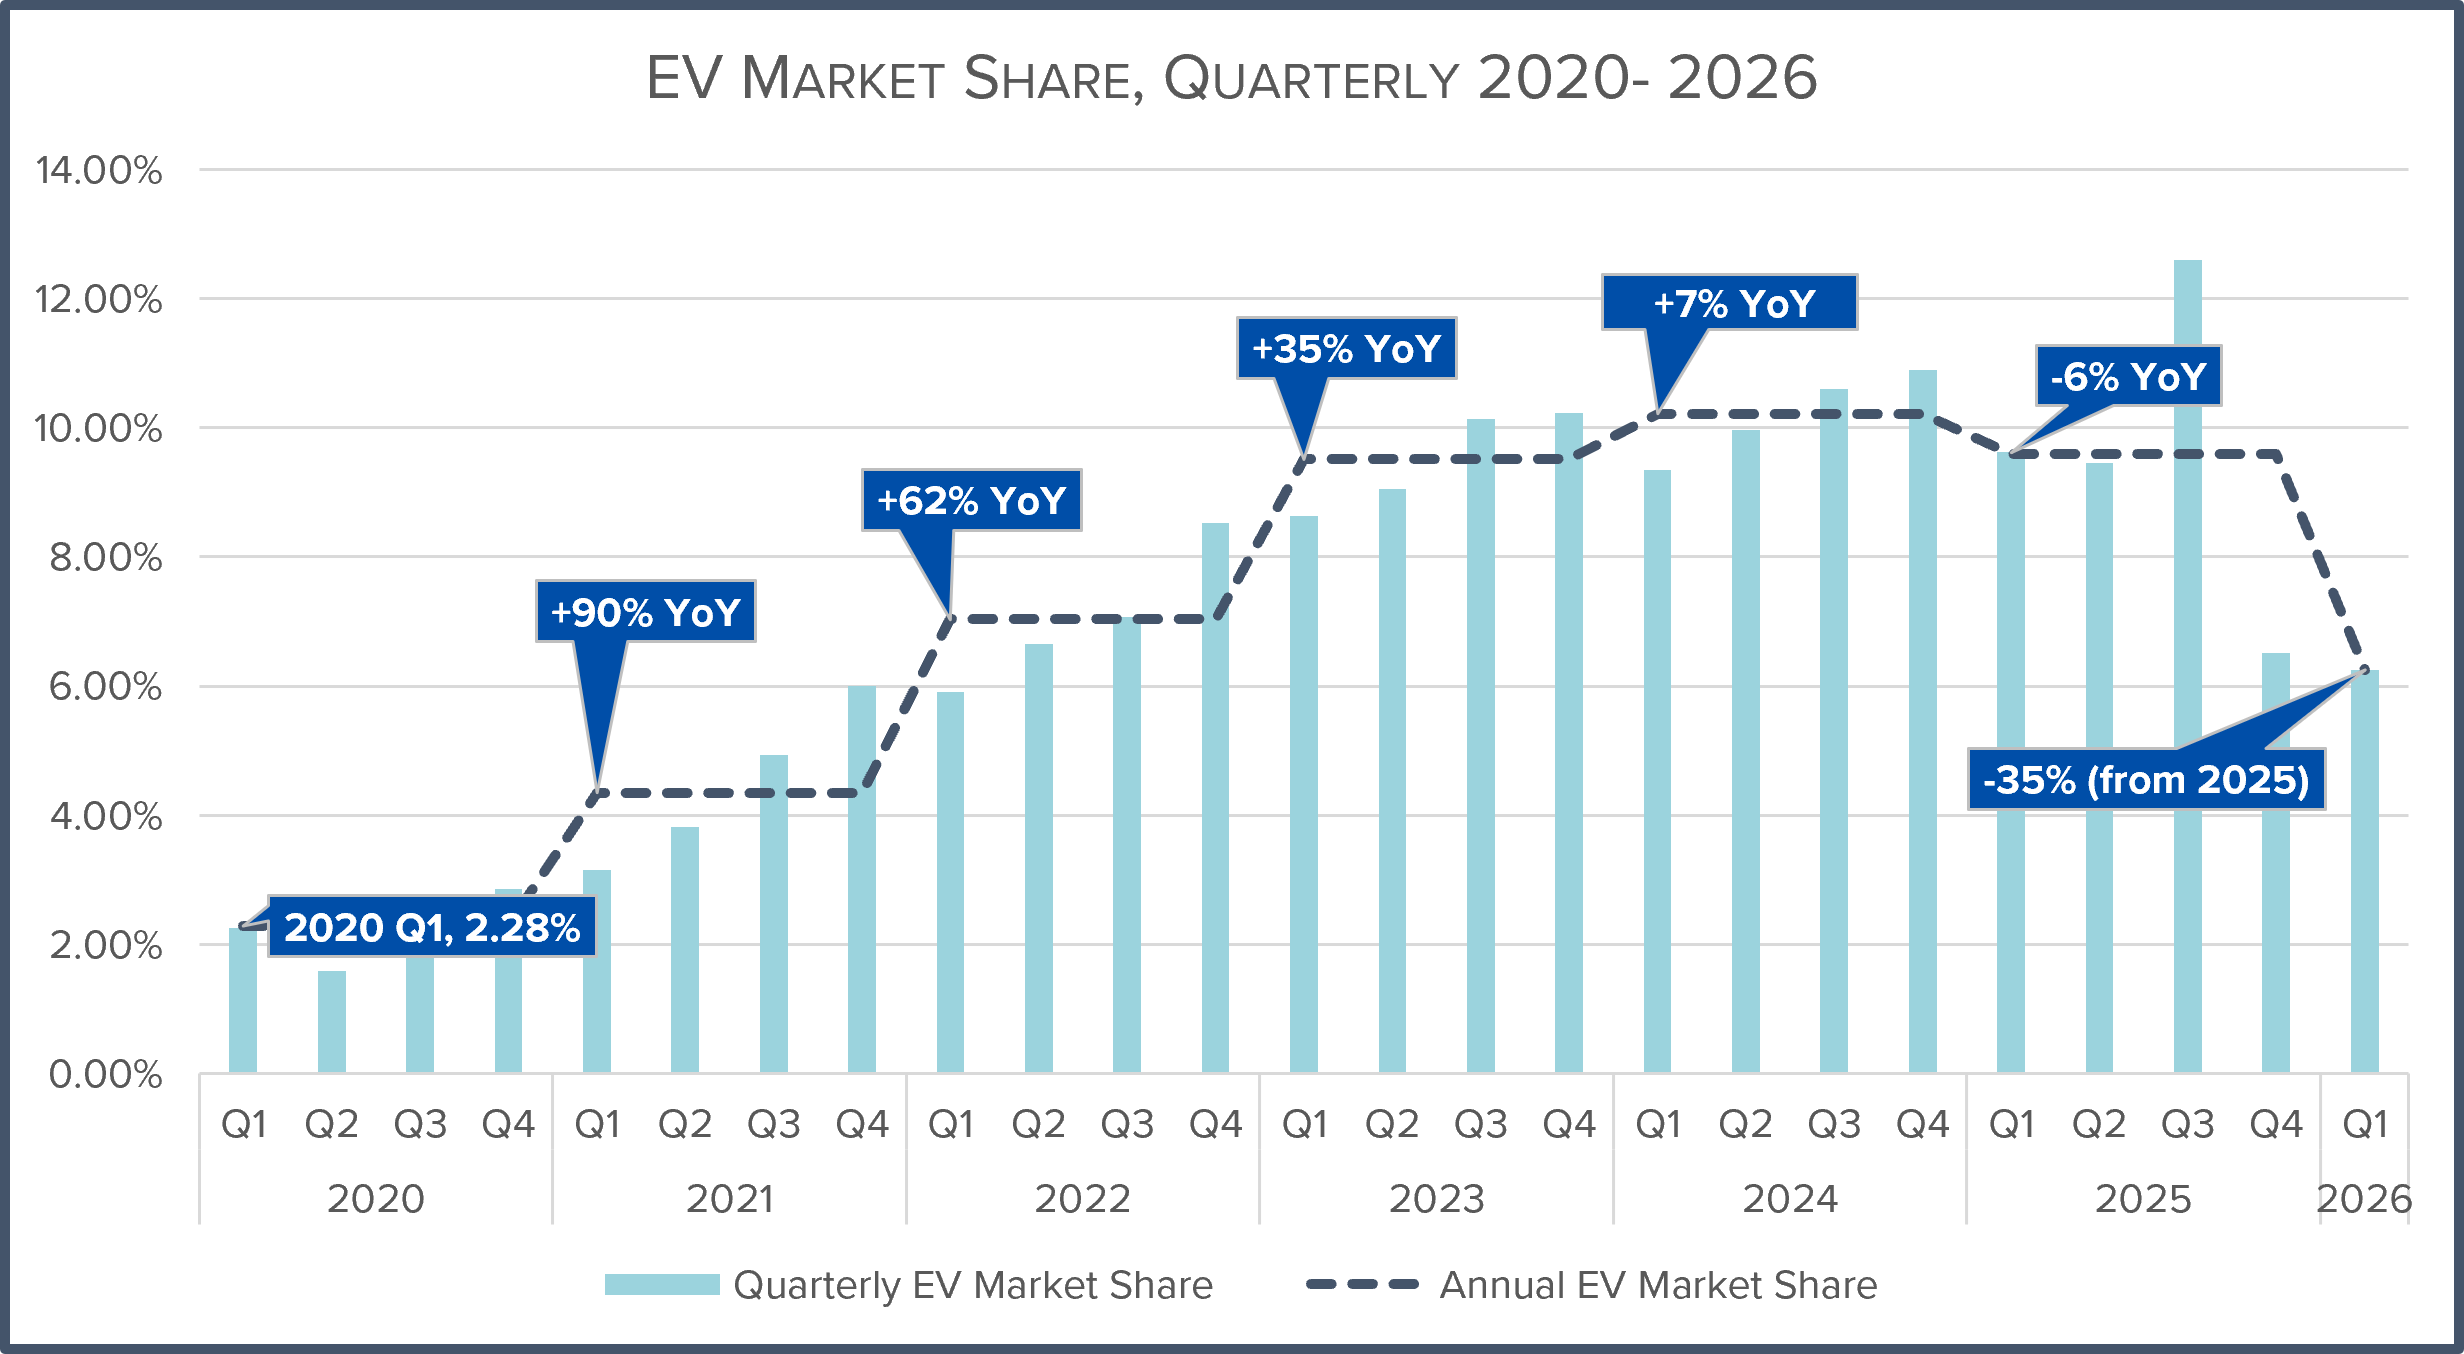
- EVs represented 6.3 percent of new U.S. light-duty vehicle sales in Q1 2026, down from 6.5 percent in Q4 2025 (a decrease of about 19,000 units).
- Year-over-year, EV market share declined 3.4 percentage points in Q1 2026 compared with Q1 2025 and saw a 39 percent decrease in EV volume (approximately 148,000 vehicles). Internal combustion engine vehicle market share increased by 0.5 percentage points.
EV market share increased in 26 states, and decreased in 23 states and the District of Columbia compared with Q4 2025.
- California (17.5 percent) led the country in EV registrations in Q1 2026, up 0.6 percentage points from the previous quarter.
- Two other states had EV registrations above 10 percent in Q1 2026: Washington (15.2 percent) and Nevada (11.6 percent).
Year-over-year (Q1 2026 vs. Q1 2025)
- Total light-duty vehicle sales (all powertrains) decreased 6.7 percent (about 260,000 fewer vehicles).
- 148,000 fewer new EVs registered in the U.S. — a 39 percent volume decrease.
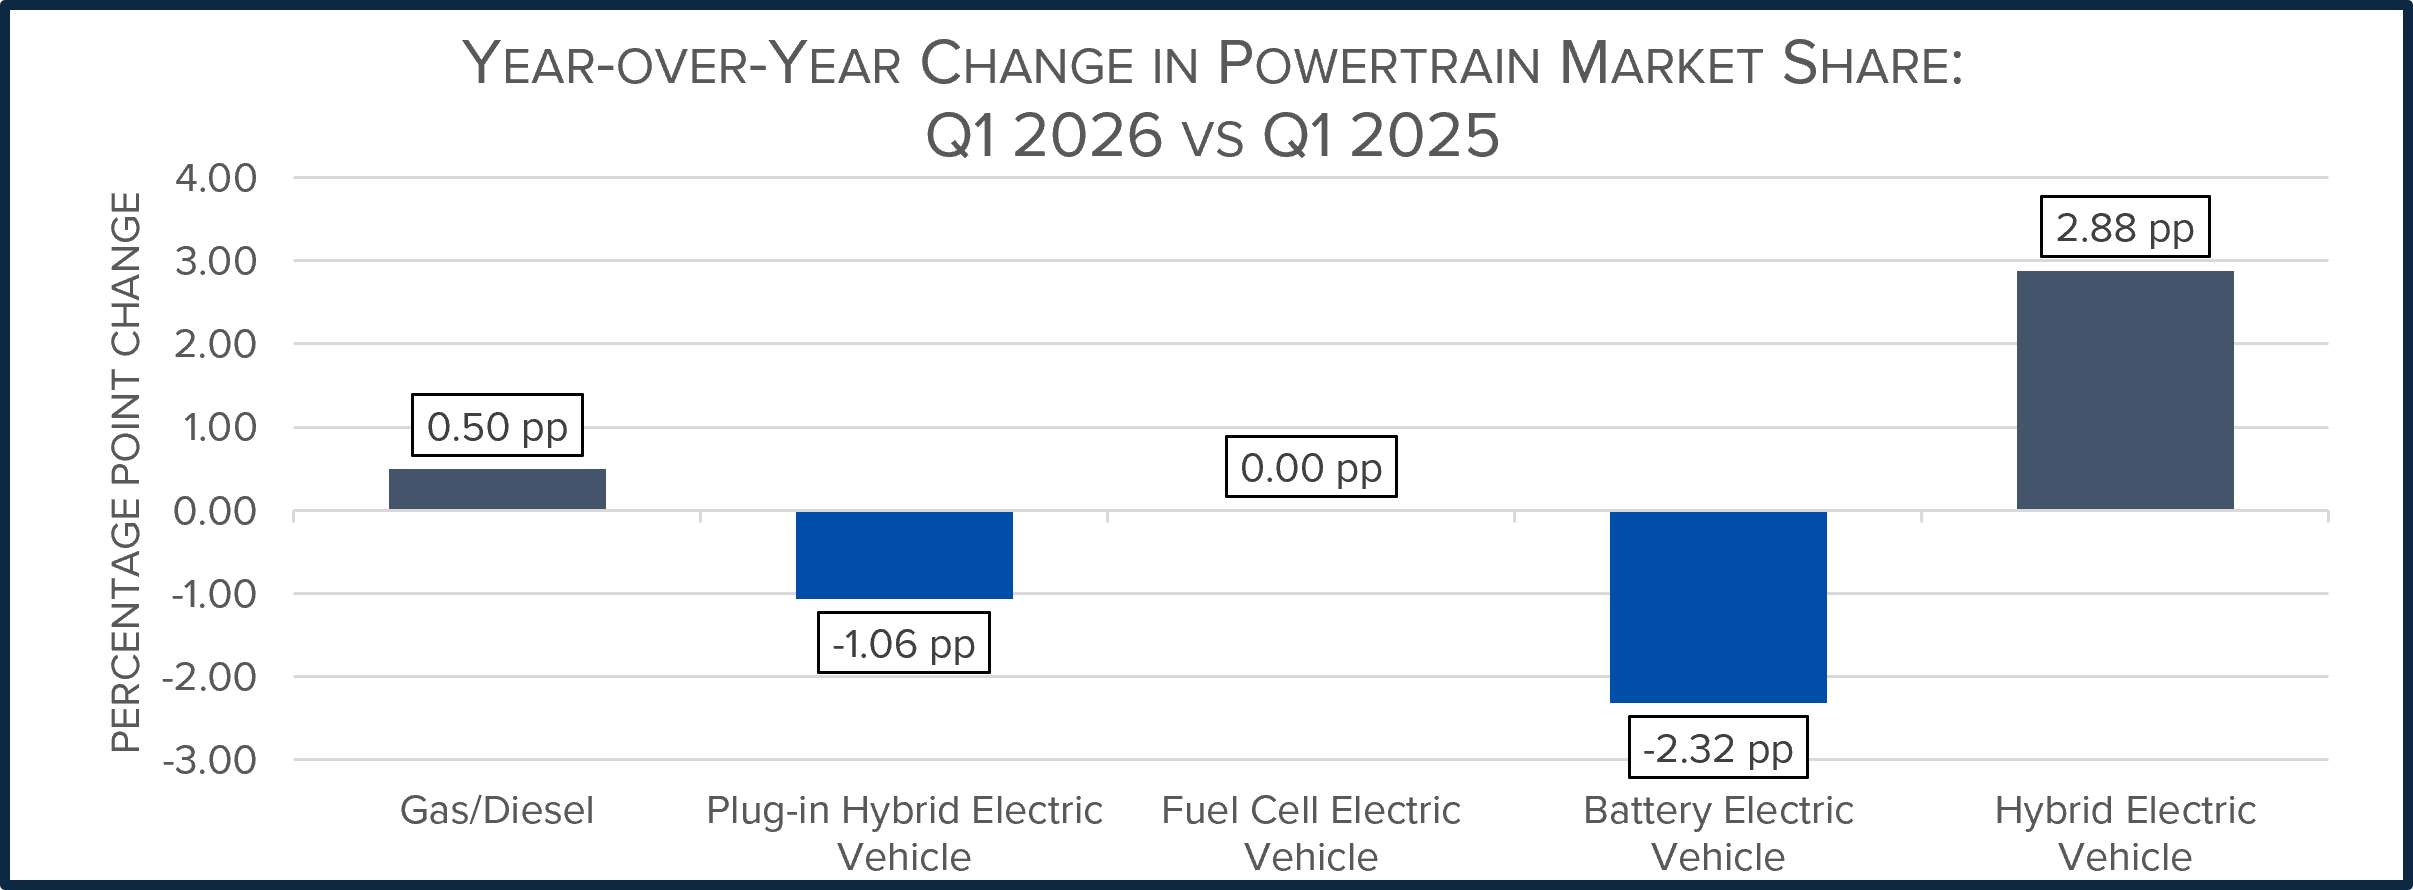
- EV market share decreased 3.4 percentage points.
- Hybrid vehicle market share grew 2.9 percentage points.
- ICE vehicle market share increased by 0.5 percentage points (second consecutive quarter to increase).
Public EV charging lags new EV registrations in Q1 2026
- In Q1 2026, the number of publicly available EV chargers increased 2 percent from Q4 2025, while total EVs on the road increased 3 percent.
- Nationwide, there were 227,747 EVs registered in Q1 2026 but only 9,212 new public chargers added — a ratio of 25 new EVs for every new public port.
- There are 7.5 million EVs on the road (2.54 percent of vehicles in operation — a new high) and a total of 242,354 publicly available charging outlets in the U.S. — a ratio of 31 EVs for every public port.
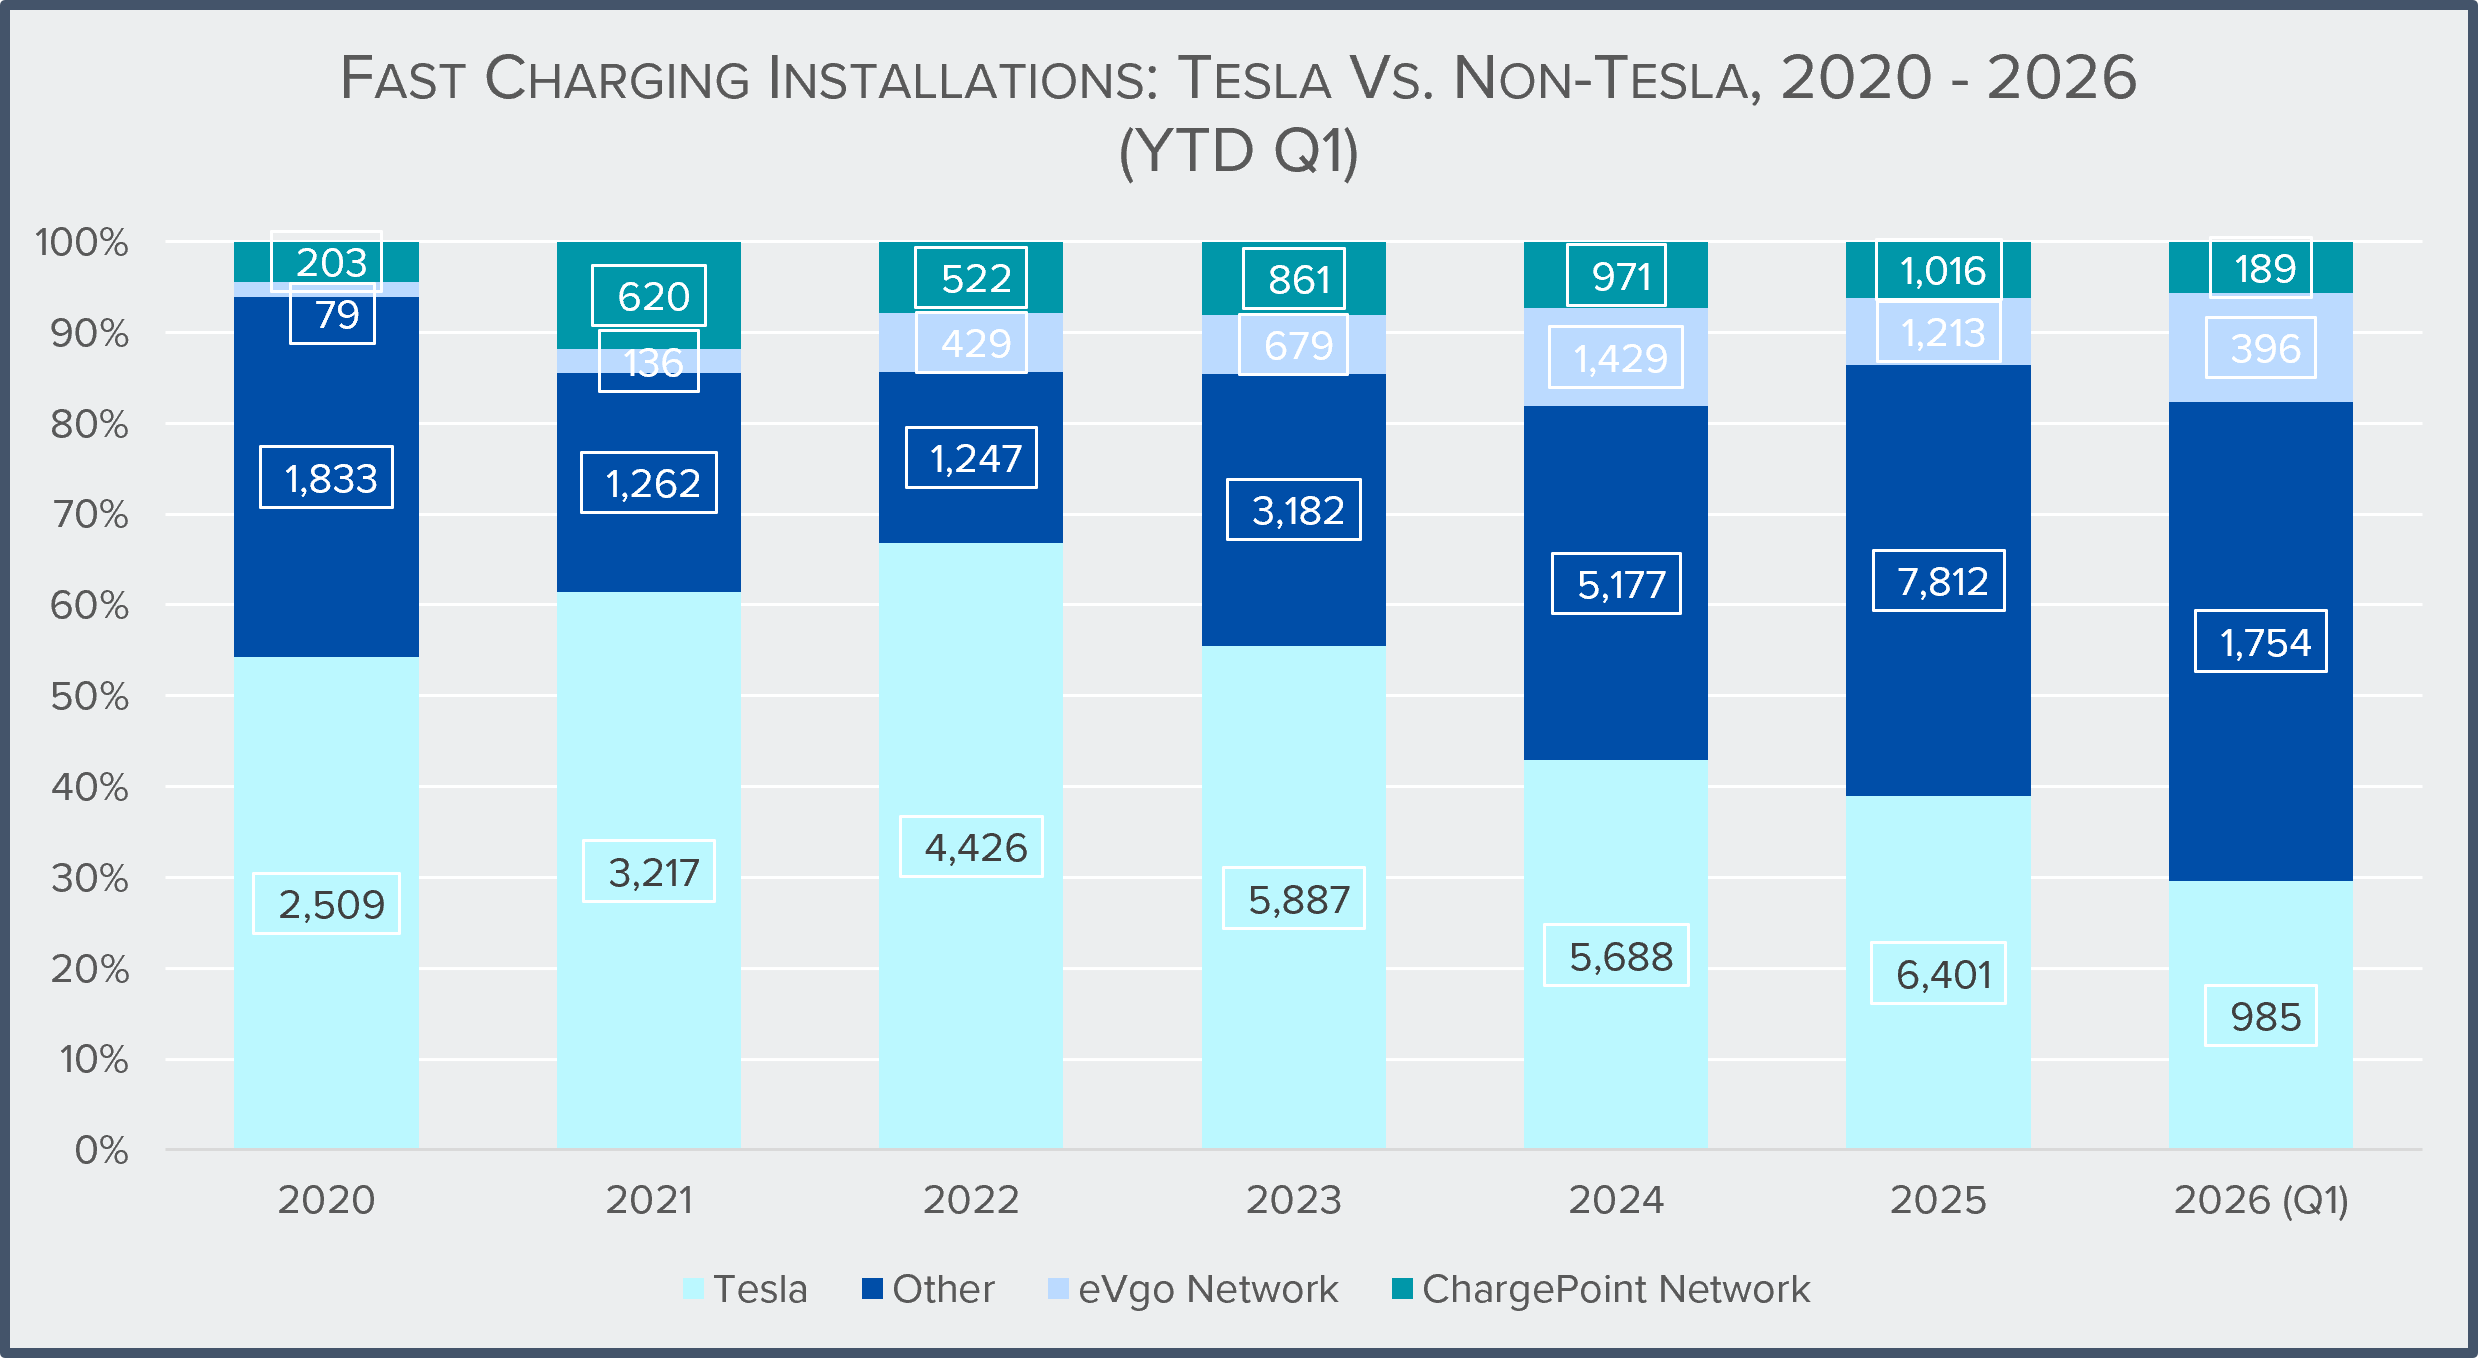
- Composition of new public charging networks is shifting: Non-Tesla fast chargers outnumber new Tesla installations. Tesla dropped from 55 percent of all new fast-charging installations in 2023 to 30 percent in Q1 2026.
Optimized EV charging to support affordability
- As the U.S. EV fleet reaches 7.5 million vehicles, the focus is shifting from simply adding charging infrastructure to now optimizing when and how vehicles charge.
- Vehicle-grid integration strategies, including optimized charging and time-of-use rates, can help lower charging costs for drivers while improving utilization of existing grid infrastructure.
- Research suggests optimized charging could avoid hundreds of dollars in annual costs per EV, while helping utilities defer costly infrastructure investments and improve grid reliability.
Click here to download the full report.


Comments are closed.