New report evaluates cities on four factors to determine overall driver quality, including accidents, speeding tickets, DUIs and citations
Seattle—Analysts at QuoteWizard set out every year to see which cities have the worst drivers in America and which have the best. They analyzed two million car insurance quotes from drivers in America’s 70 largest cities. Cities were then evaluated on four factors to determine overall driver quality. Those factors include:
- Accidents
- Speeding tickets
- DUIs
- Citations (running a red light, using a cellphone while driving, etc.)
Cities with the most dangerous driving incidents are rated among the worst, while cities with the fewest dangerous driving incidents are rated as the best. The reports findings are as follows:
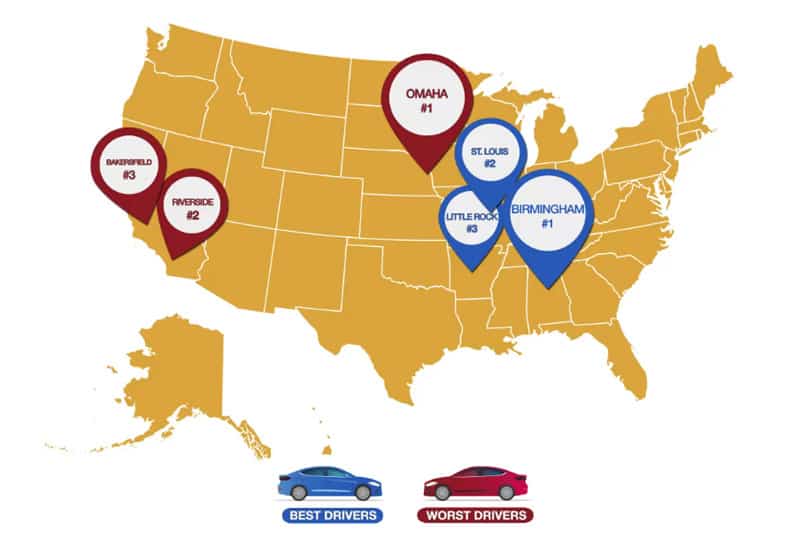
Cities with the worst drivers
| Overall rank | City | Accident rank | DUI rank | Speeding rank | Citation rank |
|---|---|---|---|---|---|
| 1 | Omaha, NE | 12 | 1 | 14 | 7 |
| 2 | Riverside, CA | 7 | 12 | 13 | 3 |
| 3 | Bakersfield, CA | 11 | 3 | 18 | 12 |
| 4 | Columbus, OH | 9 | 4 | 19 | 13 |
| 5 | Richmond, VA | 18 | 2 | 17 | 11 |
| 6 | Fresno, CA | 20 | 5 | 20 | 14 |
| 7 | Sacramento, CA | 8 | 9 | 24 | 18 |
| 8 | Salt Lake City, UT | 5 | 10 | 25 | 19 |
| 9 | Austin, TX | 10 | 17 | 8 | 25 |
| 10 | Baltimore, MD | 2 | 42 | 15 | 9 |
| 11 | Virginia Beach, VA | 21 | 11 | 26 | 20 |
| 12 | Boise, ID | 31 | 8 | 23 | 17 |
| 13 | Denver, CO | 16 | 14 | 28 | 22 |
| 14 | San Diego, CA | 6 | 19 | 32 | 27 |
| 15 | Phoenix, AZ | 26 | 20 | 11 | 28 |
| 16 | Madison, WI | 44 | 6 | 21 | 15 |
| 17 | Houston, TX | 28 | 36 | 16 | 10 |
| 18 | Las Vegas, NV | 23 | 24 | 12 | 32 |
| 19 | Minneapolis, MN | 48 | 7 | 22 | 16 |
| 20 | Dayton, OH | 29 | 15 | 29 | 23 |
| 21 | Colorado Springs, CO | 36 | 13 | 27 | 21 |
| 22 | Cleveland, OH | 35 | 16 | 30 | 24 |
| 23 | Indianapolis, IN | 34 | 18 | 31 | 26 |
| 24 | Providence, RI | 1 | 33 | 44 | 41 |
| 25 | Tucson, AZ | 38 | 21 | 33 | 29 |
| 26 | Portland, OR | 19 | 29 | 40 | 37 |
| 27 | Greenville, SC | 27 | 27 | 38 | 35 |
| 28 | Kansas City, KS/MO | 45 | 34 | 7 | 42 |
| 29 | Milwaukee, WI | 42 | 22 | 34 | 30 |
| 30 | El Paso, TX | 39 | 23 | 35 | 31 |
| 31 | Tampa, FL | 4 | 37 | 46 | 44 |
| 32 | Miami, FL | 3 | 58 | 9 | 64 |
| 33 | San Francisco Bay Area, CA | 62 | 63 | 6 | 8 |
| 34 | Albany, NY | 25 | 32 | 43 | 40 |
| 35 | Philadelphia, PA | 69 | 69 | 2 | 1 |
Omaha
After a three-year absence, Omaha has regained the top spot on our list. Omaha had more DUIs than any other city and ranked in the top 15 in every dangerous driving category. The move back to the top of the worst drivers list is a big one for Omaha. The city ranked 15th in our 2019 rankings, was number one on our worst drivers in 2018 and took the eighth-worst spot in 2017.
Riverside
Omaha may have taken the top spot for having the worst drivers, but drivers in Riverside were not far behind. Drivers in this California city also seem to have suddenly headed in the wrong direction: Riverside ranked third in 2017 and second in 2018 before moving up to 25th in 2019. Slowing down and following the rules of the road are Riverside’s largest problems; the city ranked seventh in speeding and third in citations.
Bakersfield
Drivers in this city have been near the top of our worst drivers list every year. The city ranked third highest in the nation for the number of DUIs and was in the top 20 for the number of accidents, DUIs and citations.Bakersfield was ranked the 13th worst city in 2019.
Columbus
Columbus is no stranger to fourth place: The Ohio city also came fourth in 2019 and in 2018. What’s it like to drive in Columbus? The city ranked fourth-worst in DUIs, ninth-worst in accidents and got enough citations to take the 13th worst spot.
Richmond
Are you starting to notice a pattern? Just like cities one through four, Richmond has a high number of DUIs. Richmond ranks number two for DUIs but is no slouch when it comes to speeding or citations, either. Richmond ranked 17th worst in speeding and 11th worst in citations. Virginia city ranked 10th worst in 2019.
Cities with the best drivers
| Overall rank | City | Accident rank | DUI rank | Speeding rank | Citation rank |
|---|---|---|---|---|---|
| 1 | Birmingham, AL | 60 | 65 | 70 | 70 |
| 2 | St. Louis, MO | 56 | 64 | 69 | 69 |
| 3 | Little Rock, AR | 61 | 60 | 67 | 66 |
| 4 | New Orleans, LA | 55 | 59 | 66 | 65 |
| 5 | Memphis, TN | 58 | 56 | 64 | 62 |
| 6 | Louisville, KY | 63 | 54 | 62 | 60 |
| 7 | Detroit, MI | 65 | 53 | 61 | 59 |
| 8 | Atlanta, GA | 40 | 61 | 68 | 67 |
| 9 | Baton Rouge, LA | 41 | 55 | 63 | 61 |
| 10 | Grand Rapids, MI | 64 | 47 | 55 | 53 |
| 11 | Charleston, SC | 33 | 57 | 65 | 63 |
| 12 | Honolulu, HI | 51 | 51 | 59 | 57 |
| 13 | Boston, MA | 57 | 44 | 52 | 50 |
| 14 | Nashville, TN | 37 | 50 | 58 | 56 |
| 15 | Greensboro, NC | 50 | 45 | 53 | 51 |
| 16 | Knoxville, TN | 43 | 46 | 54 | 52 |
| 17 | Pittsburgh, PA | 59 | 40 | 49 | 47 |
| 18 | Allentown, PA | 49 | 41 | 50 | 48 |
| 19 | Jacksonville, FL | 15 | 52 | 60 | 58 |
| 20 | Charlotte, NC | 22 | 48 | 56 | 54 |
| 21 | Buffalo, NY | 13 | 49 | 57 | 55 |
| 22 | Durham, NC | 47 | 35 | 45 | 43 |
| 23 | Dallas, TX | 24 | 43 | 51 | 49 |
| 24 | Hartford, CT | 52 | 31 | 42 | 39 |
| 25 | Rochester, NY | 30 | 39 | 48 | 46 |
| 26 | Orlando, FL | 14 | 62 | 10 | 68 |
| 27 | Lexington, KY | 53 | 26 | 37 | 34 |
| 28 | Oklahoma City, OK | 46 | 28 | 39 | 36 |
| 29 | New York, NY | 54 | 25 | 36 | 33 |
| 30 | Tulsa, OK | 17 | 38 | 47 | 45 |
| 31 | Seattle, WA | 68 | 68 | 3 | 5 |
| 32 | Chicago, IL | 70 | 67 | 1 | 6 |
| 33 | San Antonio, TX | 66 | 70 | 5 | 2 |
| 34 | Wichita, KS | 32 | 30 | 41 | 38 |
| 35 | Los Angeles, CA | 67 | 66 | 4 | 4 |
Birmingham
Drivers in this Alabama city like to take it easy. Birmingham had fewer speeding tickets and driving citations than any other city. That safe-driving culture is also why the city ranks low in their numbers of DUIs and accidents. After all, when you’re in Birmingham, you take it slow and appreciate the magic of the “Magic City.” Birmingham also made one of the biggest jumps on this list: The city was ranked 29th best in our 2019 rankings.
St. Louis
Meet me in St. Louis for some good driving. This Missouri city was so close to taking the number-one spot. Only one point separates St. Louis from Birmingham when it comes to the number of speeding tickets, driving citations and DUIs. The only ranking St. Louis is really behind Birmingham is in its lead foot: St. Louis had significantly more speeding tickets than Birmingham.
Little Rock
Little Rock drivers are good and getting better. Drivers in this Arkansas city ranked sixth best in 2019 and seventh-best in 2018 and 2017. The city ranks as one of the 10 best in every category and almost took the bronze medal when it comes to their number of speeding and citations. The city has also recently enacted some new driving policies. Little Rock started designing streets to better accommodate pedestrians, and the city has launched a Friendly Driver Certification Program.
New Orleans
Bourbon Street may be famous, but New Orleans actually has a comparatively low number of DUIs. The Big Easy also likes to take it easy on the road: New Orleans ranked in the top five for the lowest numbers of speeding tickets and citations and in the top 15 for the fewest accidents and DUIs.
Memphis
Memphis is famous for the blues and Rock ‘n’ Roll but it’s the city’s drivers that are music to our ears. This Tennessee city didn’t make our good drivers list last year, so moving all the way up to number five is impressive. Memphis ranks as one of the 10 best in both speeding and citations and in the top 15 for the lowest numbers of accidents and DUIs.


Comments are closed.