How does your dealership compare against your manufacturer and competitor’s national rates?
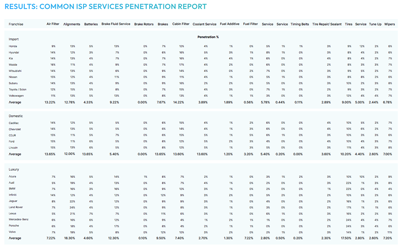
Las Vegas—In this report from Dynatron Software, the company used its comparative data to show penetration percentages for 18 different common services across 31 OEMs. The manufacturers are grouped into the following categories: Import, Domestic, and Luxury.
Dynatron stated it created this to allow dealerships to compare their rate against national percentages for their manufacturers in order to determine potential deficiencies and opportunities for improving service bay revenue.
RESULTS: COMMON ISP SERVICES PENETRATION REPORT
(Click to enlarge)
Dynatron encourages dealerships to consider the following questions when analyzing its report data:
• Which services does my dealership have a higher penetration percentage than the national average for my OEM?
• Are there any common services where my dealership falls short of the national average?
• If my dealership performs better than the national average for my OEM, how do my penetration percentages compare to my classification group?

To enhance common services penetration in the service bays, proactive customer engagement is important, states Dynatron. “Each interaction on the service drive is an opportunity to sell; if you don’t ask, you’re missing out. Take the example of asking 10 people and 2 say yes, that’s securing 20% penetration — every inquiry counts. By adhering to the vehicle’s maintenance schedule, service advisors can ensure they’re not leaving money on the table.”
Additional recommendations:
• “Educating customers during the menu presentation about necessary maintenance tasks and their timing during vehicle ownership is crucial. It’s not just about making them aware certain services are due, but also guiding them to say yes.”
• “Customers trust Service Advisors to be subject matter experts (SMEs), so failing to engage with them erodes that credibility. Even if they decline, you still earn recognition for being knowledgeable and recommending what they needed. It’s about seizing the opportunity while reinforcing expertise.”
Download the full report here. To compile this report, Dynatron analyzed more than 18 million repair orders from all job types pulled from dealerships across all 50 states from Feb. 1, 2023 to Jan. 31, 2024. The data points used included the total RO count for each OEM across all job types, along with the total RO count for each common service. The penetration percentage was calculated by taking the OEM’s RO count for the common service and dividing it by the total RO count.


Comments are closed.