
Report features a breakdown of light-duty market share by powertrain and an analysis of registered EVs and charging infrastructure
Washington, D.C.—Alliance for Automotive Innovation released its state-by-state analysis of the U.S. electric vehicle market for the second quarter of 2026, which summarizes EV sales and purchasing trends across all 50 states.
The analysis features a breakdown of light-duty market share by powertrain (2016-2026) and an analysis of registered EVs and charging infrastructure.
The following are quick-hit highlights from the report.
KEY TAKEAWAYS
161 electric models now available for sale in U.S.; EV sales rebound quarter-over-quarter but remain down year-over-year
- 161 electric car, utility vehicle, pickup truck and van models were available for sale in the U.S. in Q2 2026, up from 154 models in Q1 and nearly returning to the 164 models available at the end of 2025.
- Light trucks represented 81 percent of Q2 EV sales, down from the first-quarter record (86 percent) as passenger car and van sales grew.
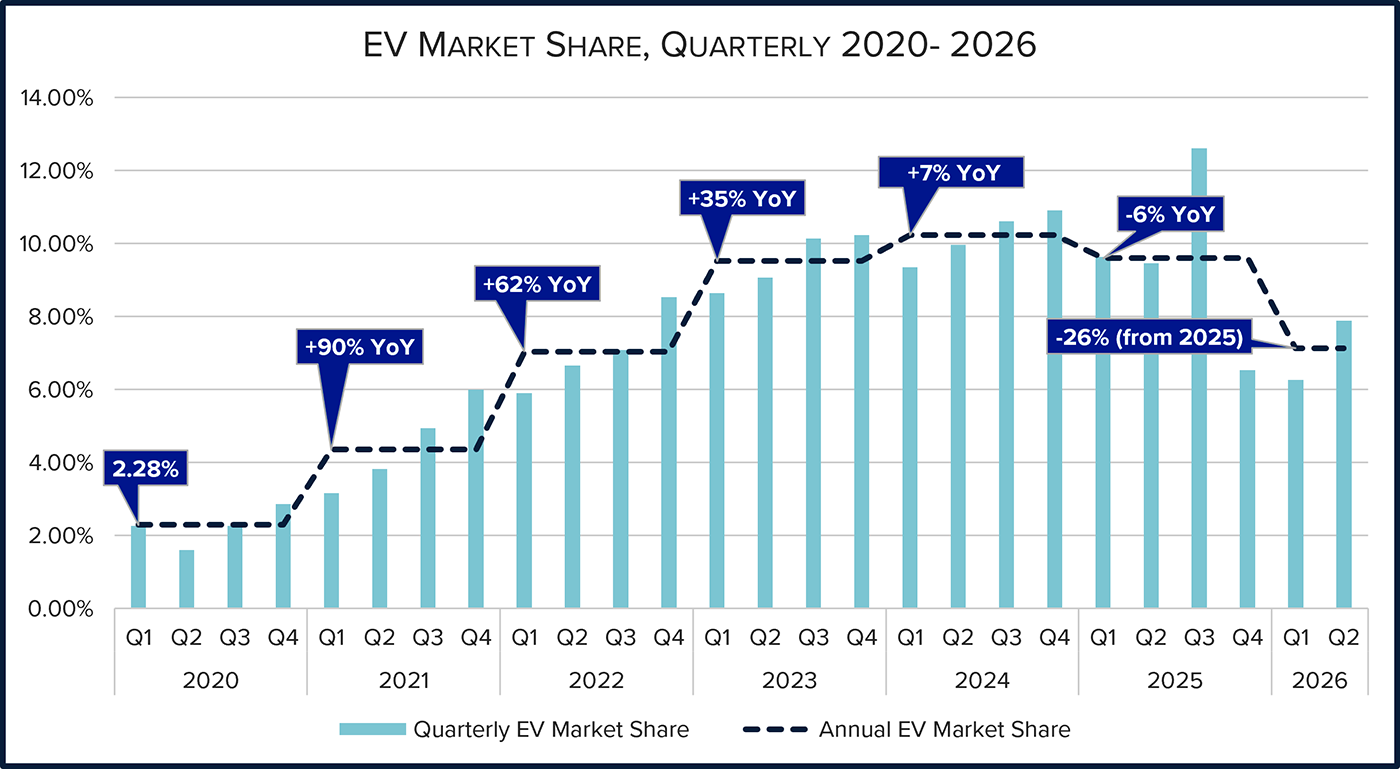
- EVs represented 7.9 percent of new U.S. light-duty vehicle sales in Q2 2026, up 1.6 percentage points from Q1 and marking the first sequential gain since Q3 2025.
- Year-over-year, EV market share declined 1.6 percentage points compared with Q2 2025, and EV sales volume declined 15 percent (roughly 56,200 vehicles). Overall, new U.S. light-duty vehicle sales (all powertrains) increased 2 percent.
- Through the first half of 2026, automakers sold 556,477 EVs, representing 7.1 percent of new light-duty vehicle sales. Compared with the first half of 2025, EV sales declined 26.8 percent (roughly 204,250 vehicles), and market share declined 2.4 percentage points from 9.5 percent.
EV market share increased in 47 states and the District of Columbia compared with Q1 2026 and declined in only four states.
- California (21.2 percent) led the country in EV registrations in Q2 2026, followed by Washington (17.5 percent) and Nevada (15.4 percent).
- Two additional states (Oregon and Colorado) and the District of Columbia had EV registrations above 10 percent in Q2 2026.
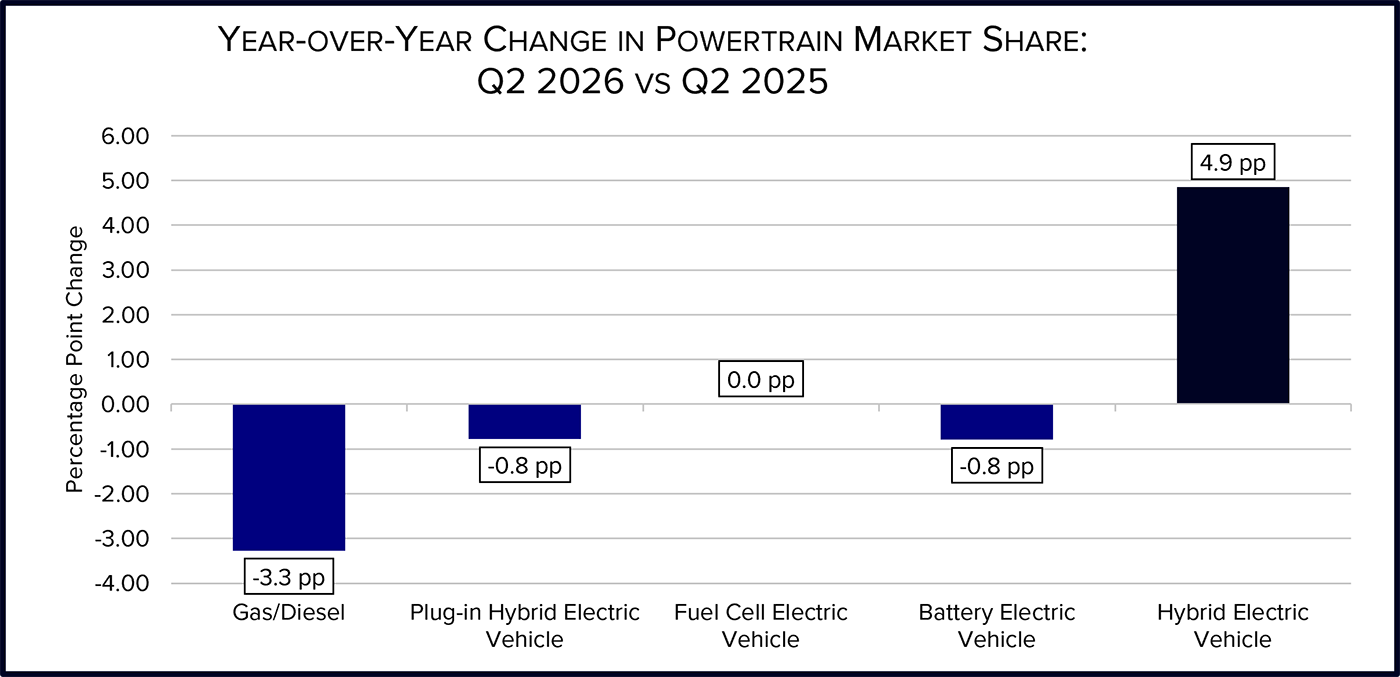
Year-over-year (Q2 2026 vs. Q2 2025)
- Total light-duty vehicle sales (all powertrains) increased 2 percent.
- New EV sales in the U.S. were down 15 percent (approximately 56,200 fewer units).
- EV market share decreased 1.6 percentage points to 7.9 percent (from 9.5 percent).
- Hybrid vehicle market share grew 4.9 percentage points to 22.2 percent (from 17.3 percent).
- ICE vehicle market share decreased 3.3 percentage points to 69.9 percent (from 73.2 percent), resuming its decline after increasing year-over-year in Q1.
Public EV charging infrastructure continues to expand in Q2 2026:
- The number of publicly available EV charging ports increased 3.2 percent from Q1 2026, while the number of EVs in operation increased 4.3 percent.
- Public charging infrastructure totaled 250,158 ports nationwide, including 177,139 Level 2 ports and 73,019 DC fast charging ports.
- There are roughly 7.8 million EVs on the road (2.63 percent of vehicles in operation) — a new high — and about 31 EVs for every public charging port.
China
- China accounted for roughly 70 percent of global EV production in 2025 and more than 80 percent of global battery cell production.
- As China’s domestic EV ecosystem reaches enormous scale, Chinese automakers are increasingly expanding into global markets through exports and overseas production.
Download the full report here.



Comments are closed.